Activity Recognition
Classification of activities using IMU data collected from a wristwatch and mobile phone.
Background
This project took place during my junior year at the University of California - Irvine and was meant to simulate a real world machine learning task from start to finish. The dataset was provided by the universities public machine learning repository and required significant manipulation before it was in workable condition. The aim of the project was to use accelerometer and gyroscopic data from a users wristwatch and mobile phone to estimate their current activity. Data from both devices was sampled at a rate of 20Hz. The dataset included recordings from 51 different test subjects each conducting 18 different activities for three minutes a piece. Different classical machine learning models were evaluated including : k-Nearest Neighbors, Random Forests, Support Vector Machines and Linear and Quadratic Discriminant Analysis.
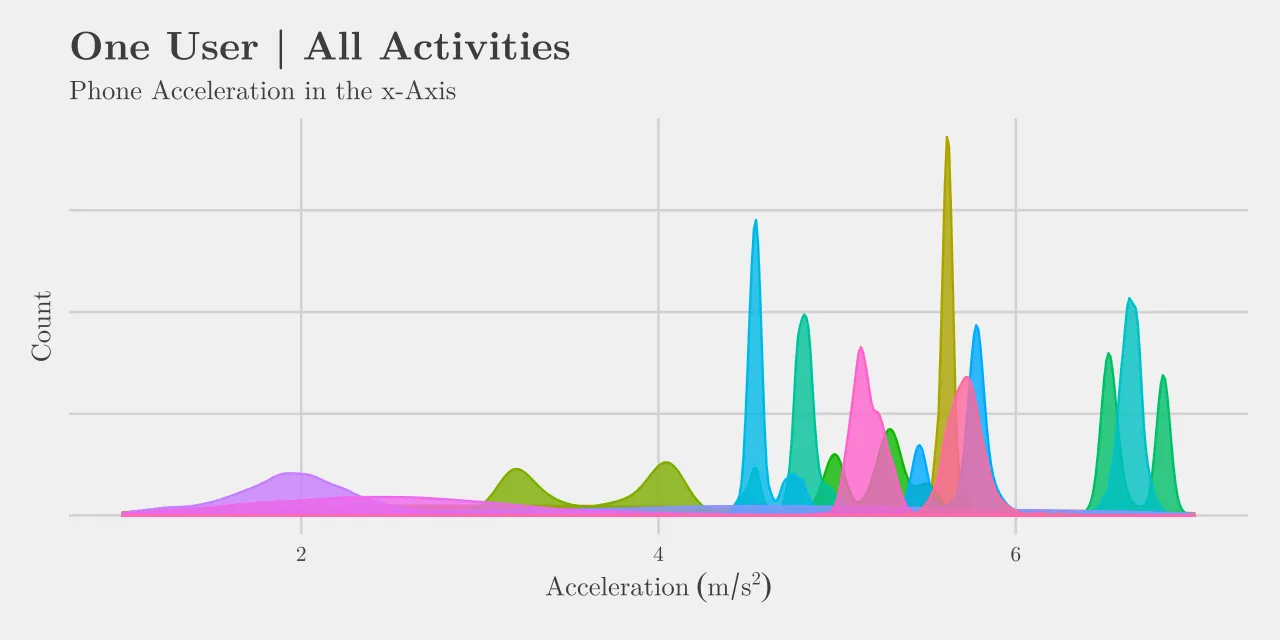
Below are some illustrations of how the data is distributed for different activities and users. Both plots only show data for the x-axis acceleration of the users mobile phone, which is only one of twelve different datapoints collected at each instance in time. Tall peaks in both plots indicate a resting state at a particular orientation. When the distribution is spread thin it indicates the user was moving across these states of acceleration throughout the activity. It is not clear from this data alone how the algorithm would separate each activity but it should help to give a better understanding of what we are dealing with.
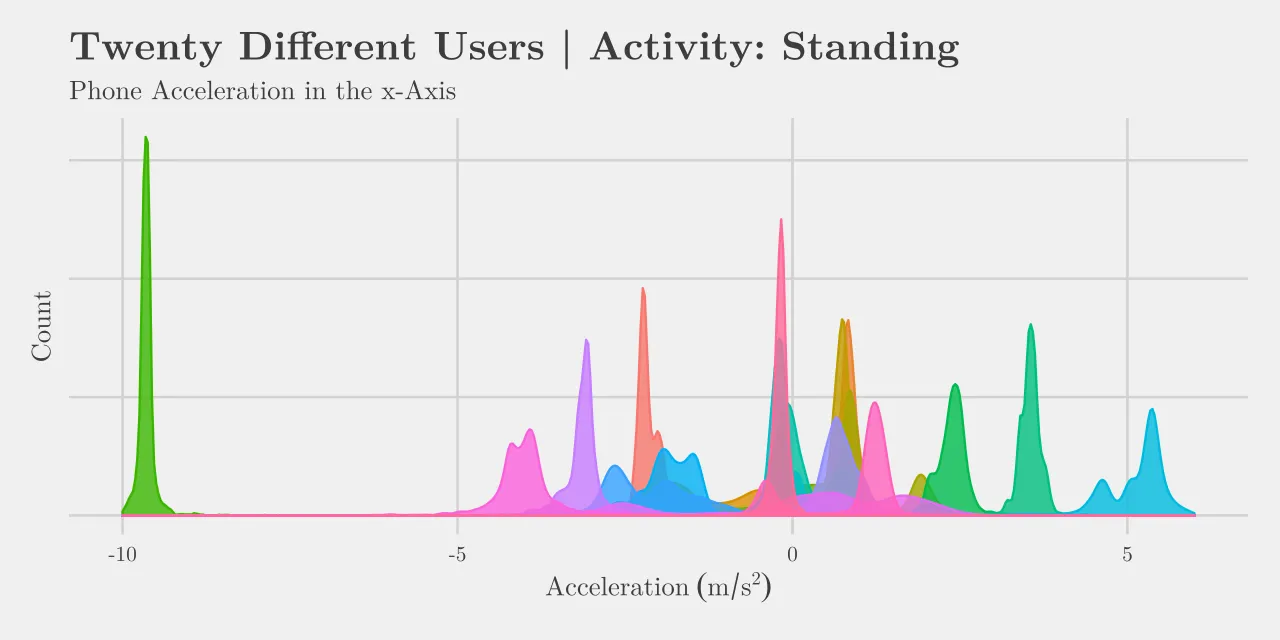
Below we see data for one activity from twenty different users. Standing still is sure to give us a concentrated set of acceleration data however each user has their phone oriented relative to their body in different ways. From this it should be clear that the exact mobile phone orientation will be less significant than the relative changes in acceleration when it comes to predicting various activities.
Data Pre-Processing
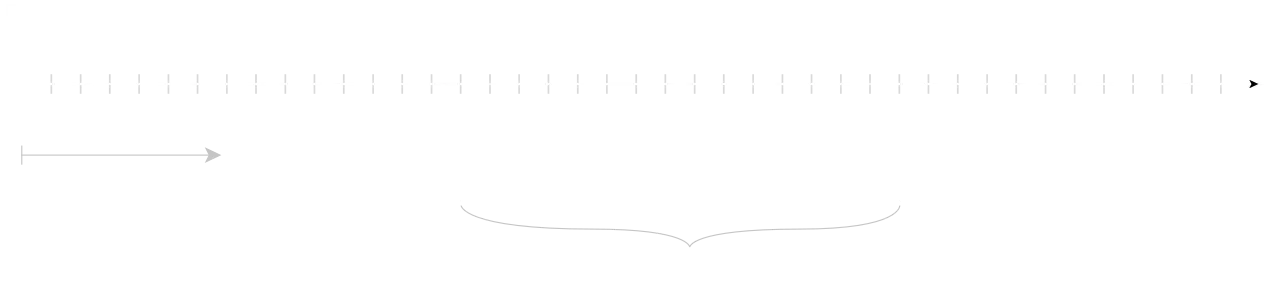
With gigabytes of data, spread across many different files and folders, this stage of the project was easily the most laborious. Eventually everything was packed neatly into one single data structure, using a windowing method that I try to illustrate in the below graphic. Looking at windows of time allows for richer insights into the what the user is doing and was a necessary feature considering the models I used for training were time-agnostic.
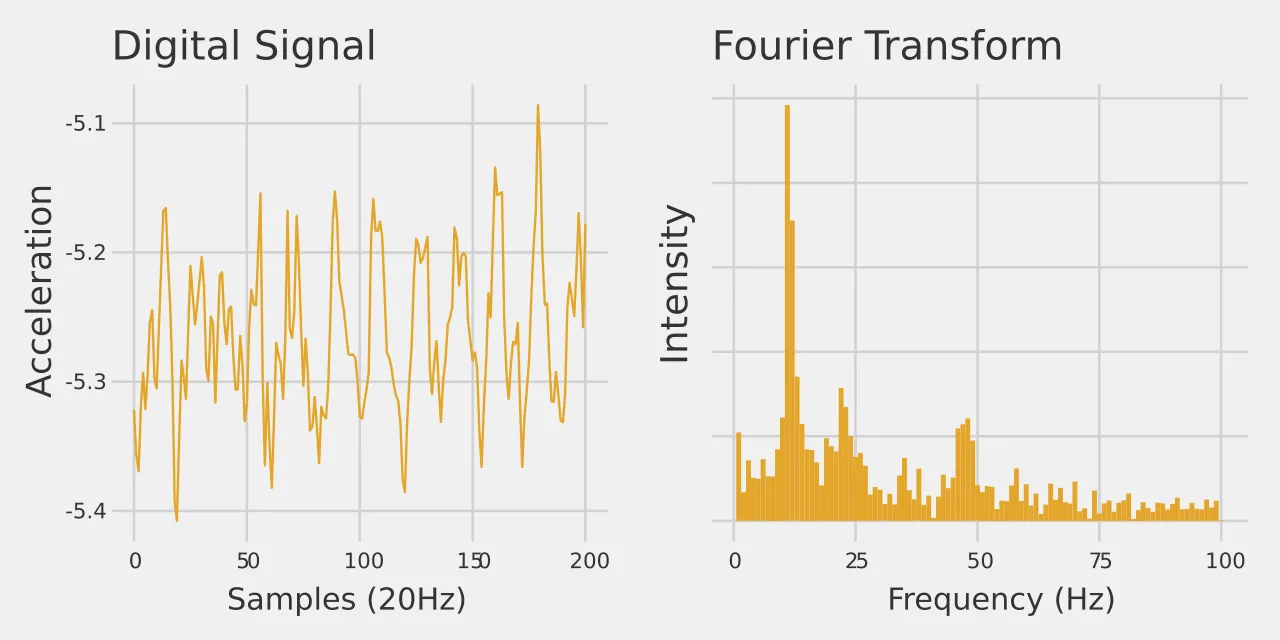
Features were then extracted from each window, these included the mean value, variance, most prominent frequency, integral and more. I include a neat example of when the most prominent frequency, calculated by performing a fourier transform, might be of use. In this example, it is clear that the back and forth motion of the users arm while brushing their teeth is being registered by the watches accelerometer.
Learning
The machine learning algorithms covered throughout the course are what is considered to be the traditional set of algorithms, of which I am excluding the now very popular network architectures (so LSTM's are out). The models I did use include; quadratic discriminant analysis (QDA), k-Nearest Neighbor (KNN), support vector machines (SVM) and random forests (RF). I will not explain how each of these work but if you want more context you are free to look at the full report attached at the end.
Results
Again, I will abbreviate my analysis of the results here and instead point you towards the full paper. I will however share this table;
| Model | Accuracy |
|---|---|
| QDA | 53.96% |
| KNN | 54.89% |
| SVM-Linear | 62.78% |
| SVM-Polynomial | 59.67% |
| SVM-Radial | 65.77% |
| RF | 70.47% |
Accuracy here means that the model correctly predicted the activity taking place during a window of recorded time. I also discovered, rather intuitively, that discerning between similar activities, such as the eating of different types of food, was much harder than predicting whether the user was either writing or clapping.
Anyways, here is the full report.