Computer Vision
Improving the semantic segmentation of fisheye distorted images while maintaining a wide field of view
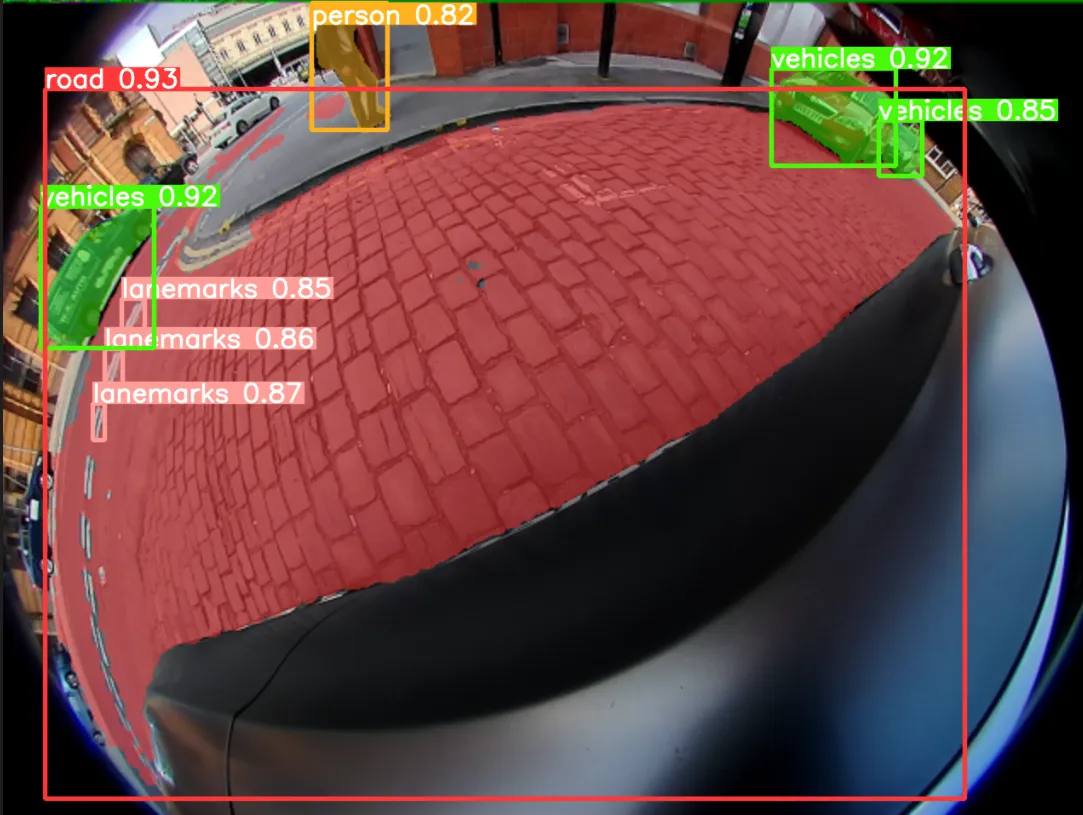
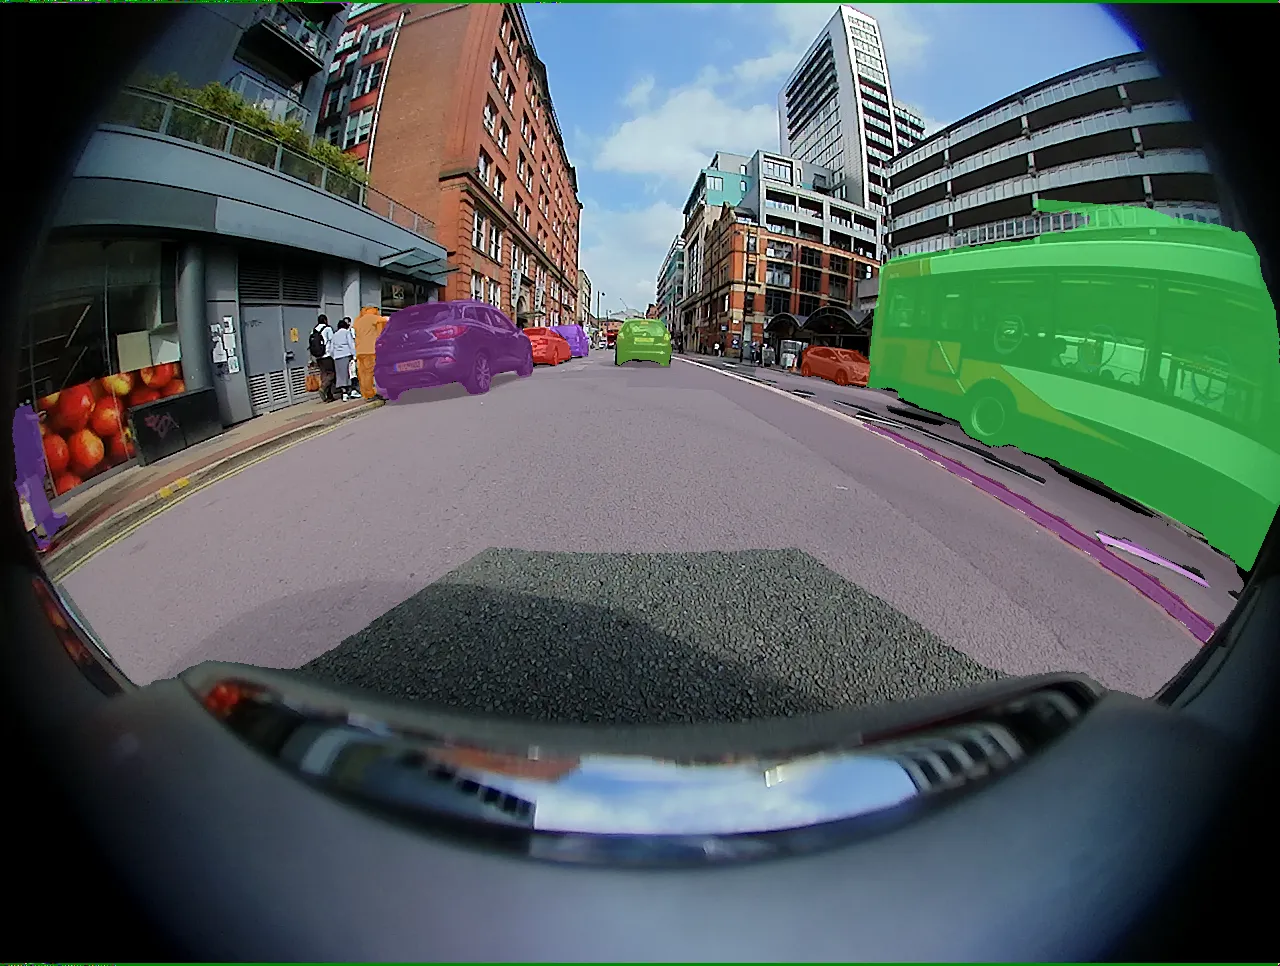
For my master's thesis at LTH I worked with Axis Communications AB to explore the use of fisheye cameras for computer vision. Fisheye cameras are characterized by their wide field of view, typically near or above 180 degrees. Such a large field of view results in heavy image distortion, as can be seen in the below picture. This distortion is effectively compressing information about the environment at varying amounts across the image. Objects at the center appear relatively undistorted while objects at the periphery are more heavily distorted. In turn, this variable compression of information is not handled well by traditional computer vision models such as YOLOv5 or any convolutional neural network (CNN) based architecture for that matter. This is because the convolution operation is applied equally to all pixels across the image, even though pixels at the far periphery might be more information dense than pixels near the center.
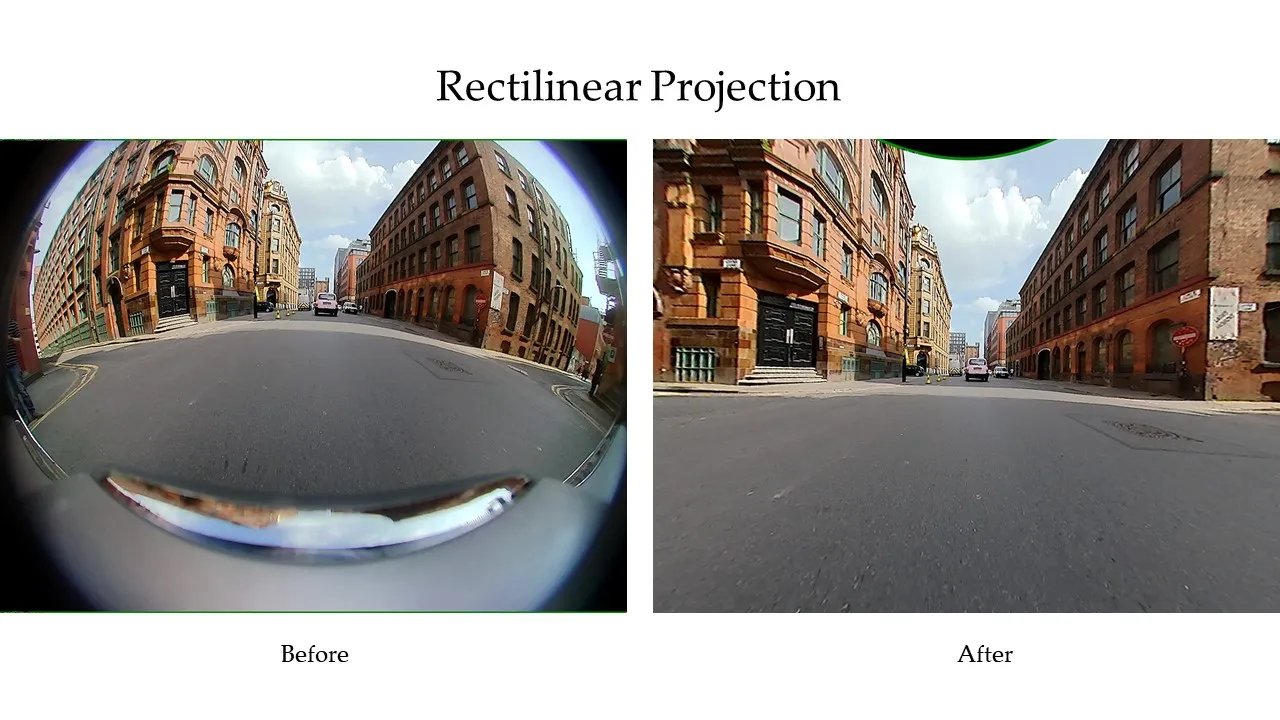
Rectilinear images, like the one below, work much better with CNN models, as there is no distortion and information is equally dense across the image. This is why fisheye images are often rectified to remove distortion before being processed for segmentation or detection. This, however, has the key drawback of removing the fisheye images original field of view, cropping much of what could be seen in the originally distorted image.
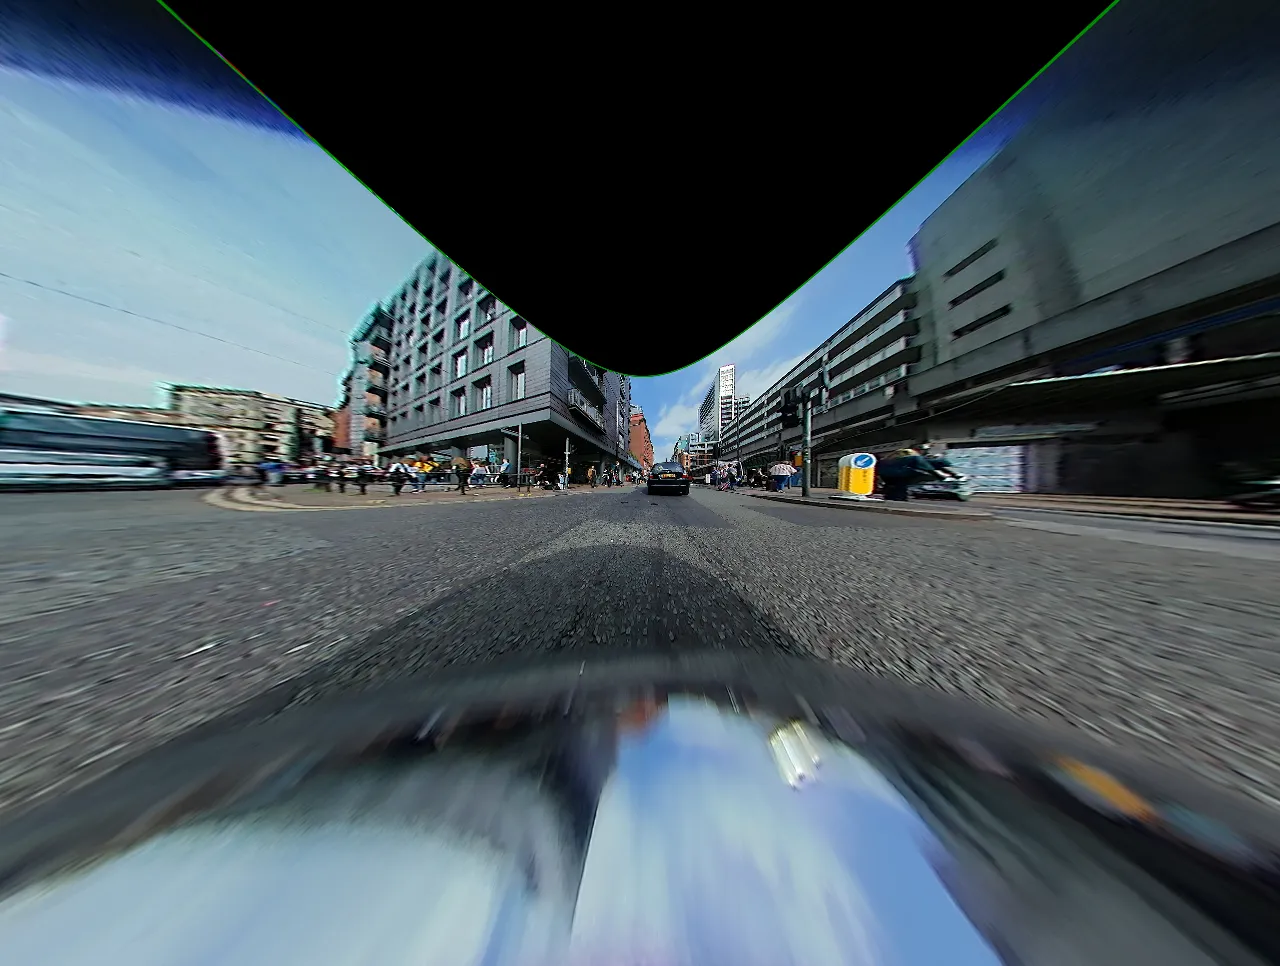
It is technically possible to rectify the image and maintain the field of view but as you can see in the next image, this leads to some inaccuracies and objects at the center becoming much too small for effective detection.
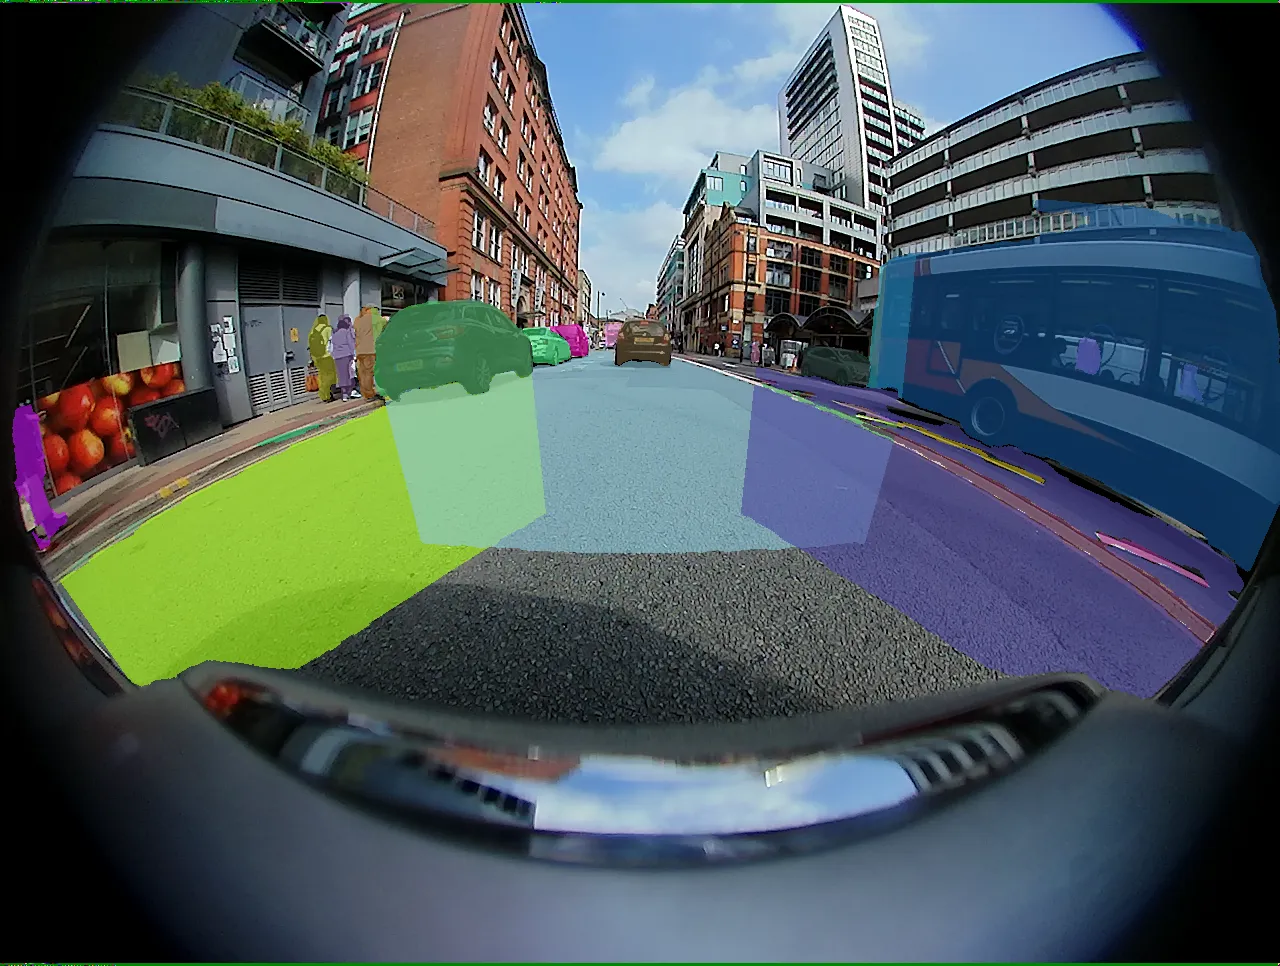
In our project we set out to benchmark the performance of different rectification methods and finally propose the use of tiled rectification, where the original fisheye image is sampled into smaller tiles and then rectified. These tiles are meant to span the wide field of view of the original image while keeping objects in the image at a manageable scale. Segmentation predictions are then made on the rectified tiles, separately, finally merging predictions from each tile into one group of predictions as illustrated in the below images.
The full report can be found here. (beware, it's a bit long!)